More Information
|
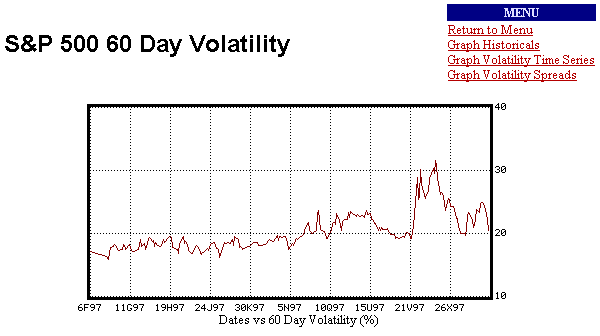
GRAPH 60 DAY VOLATILITY |
As expiration nears, option contracts tend to behave more erratically. This
makes volatility analysis over time more difficult. Furthermore, contracts
are constantly being added and expiring, so the problem of seeing volatility
patterns over an extended period is compounded. To address this, Web POP
uses current volatility information to interpolate a theoretical 60 day
volatility. It also allows you to set the 60 day to be 30 day or whatever
you prefer, as well as displaying a corresponding futures graph below the
volatility graph.
|


