Web POP: The Professional Options Package on the Internet
More Information
HISTORICAL
GRAPHS
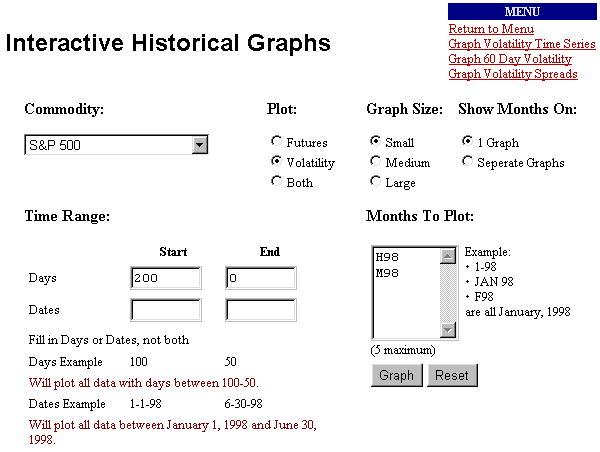
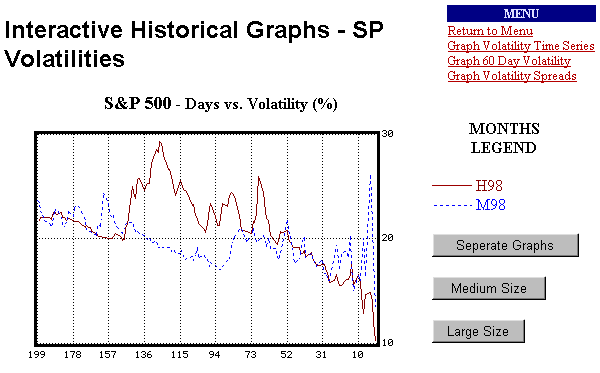
This is the "Historical Graphs" page with direct links to Web POP's other interactive graphing features. For a specified time period, past futures moves and past volatility moves are plotted. You can examine a contract's history for specific dates or by how many days are left to expiration. This allows you to compare how different months behaved as expiration approached.
Back - Next
Back - Next
Add Trades
Position Risk Analyzer
Position Details
Profit / Loss
Theoretical Price Sheets
Volatility Spread Calc
Graph Historical Volatilities
Graph the Theoretical 60 Day Volatility
Graph the Volatility Time Series
Graph Volatility Spreads

PMpublishing Home Page
Professional Options Package
Free Daily Volatility Summary
Online Options Pricing and Analysis
Consulting

E-mail PMpublishing

Copyright ©, 1998, PMpublishing