Web POP: The Professional Options Package on the Internet
More Information
VOLATILITY
TIME SERIES
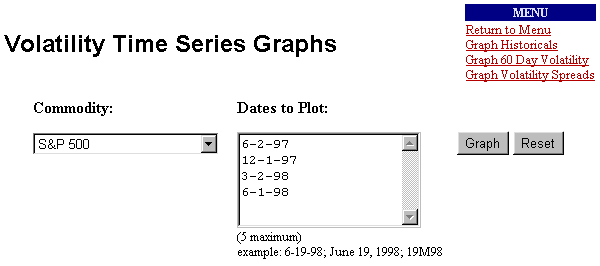
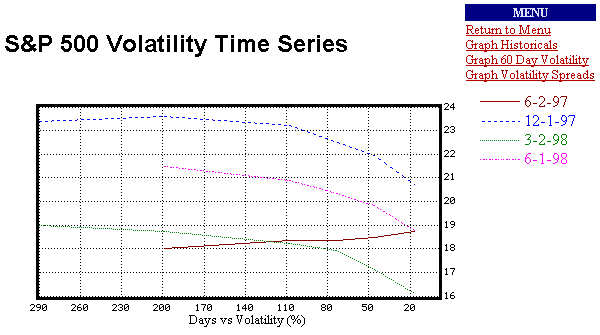
Web POP's "Volatility Time Series Graphs" allow you to see the volatilities of all contract months on a single graph. This is called the volatility time series. It visually indicates whether the back months are trading at higher volatilities than the front months. You cann see this same line for different dates in the past. In the example below, all the lines slope down except the one from 6-2-97. Opportunity? Indicator?
Back - Next
Back - Next
Add Trades
Position Risk Analyzer
Position Details
Profit / Loss
Theoretical Price Sheets
Volatility Spread Calc
Graph Historical Volatilities
Graph the Theoretical 60 Day Volatility
Graph the Volatility Time Series
Graph Volatility Spreads

PMpublishing Home Page
Professional Options Package
Free Daily Volatility Summary
Online Options Pricing and Analysis
Consulting

E-mail PMpublishing

Copyright ©, 1998, PMpublishing