CME
SP ES NK ND ED EY
JY BP AD CD MP SF
LC FC LH LB
CBOT
DJ US TY WT
SB BO SM C
CBOE
SX OX
CSCE
CA CF HS
NYCE
OJ CT
NYMEX
HO CL NG HU
COMEX
GC SI HG
DAILY SUMMARY
Main Page
Opt Calc
NEW - Web POP
Bookstore
Sponsored by PMpublishing
NEW FEATURE - Web POP, interactive, online options risk management. Click Here for more information.

Daily Australian Dollar Option Analysis - Wed, April 7, 2004
Hit reload on your browser if the date is incorrect.
Help
FREE Email Summaries
Month
MAY
JUN
Futures
Closing Price

76.00
76.00
Days Left
23
43
Implied ATM
Volatility

12.18%
12.17%
Last Trading Date
Fri, May 7, 2004
Fri, Jun. 4, 2004
ArrowHistorical v. Implied Volatility Graphs
ArrowHistorical Volatility Tables
ArrowImplied Standard Deviations


MAY Implied Volatility v. 1-Month Historical Volatility
March 1, 2010 - April 7, 2010
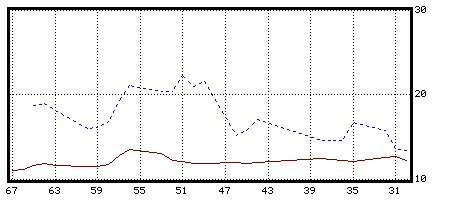
Days to Options Expiration v. Volatility (percent)
Solid line is Implied Volatility


JUN Implied Volatility v. 1-Month Historical Volatility
January 26, 2010 - April 7, 2010
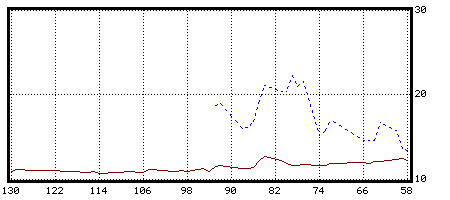
Days to Options Expiration v. Volatility (percent)
Solid line is Implied Volatility

JUN Futures
January 26, 2010 - April 7, 2010

Days to Options Expiration v. Futures Price


Historical Volatilities for AD
1-Week 2-Week 1-Month 6-Week 2-Month 3-Month 4-Month 6-Month
JUN
18.06%
12.05%
13.41%
17.89%
16.09%
n/a
n/a
n/a


Implied Standard Deviations for AD
1-Day 3-Day 1-Week 2-Week 1-Month 2-Month 3-Month ATM Vol.
MAY
JUN
.57
.57
.99
.99
1.52
1.51
2.14
2.14
3.14
3.14
4.47
4.47
5.47
5.46
12.18%
12.17%


MAY - AD Next (JUN) - Top
SETTLE (CLOSE) FAIR VALUE TICKS OVER FAIR IMPLIED VOLATILITY IMPLIED DELTA VEGA GAMMA THETA C/R
STRIKE Call Put Call Put Call Put Call Put Call Put (ticks) (ticks) (ticks)
70.5
72.0
73.0
74.0
75.0
75.5
76.0*
77.5
78.0
79.0
81.5
---
---
---
238
166
135
108
53
41
25
8
6
11
22
38
66
85
108
---
---
---
---
551
406
317
235
165
135
109
51
38
20
3
2
8
18
36
66
86
109
201
237
319
551
---
---
---
+3
+1
0
-1
+2
+3
+5
+5
+4
+3
+4
+2
0
-1
-1
---
---
---
---
----
----
----
12.58
12.26
12.13
12.06
12.40
12.55
13.06
14.73
14.94
13.18
13.02
12.45
12.20
12.10
12.06
----
----
----
----
*.96
*.92
*.85
.77
.65
.58
.50
.30
.25
.16
.06
-.04
-.08
-.14
-.23
-.35
-.42
-.49
*-.69
*-.75
*-.83
*-.94
.02
.03
.05
.07
.08
.09
.09
.08
.07
.06
.03
3
5
8
11
13
14
15
12
11
8
3
0.7
1.0
1.4
1.8
2.2
2.3
2.4
2.1
1.9
1.6
0.8
---
---
---
0
0
0
0
---
---
---
---
MAY Fut=76.00 Days=23 atmVol=12.18% IntRate = 6.50%
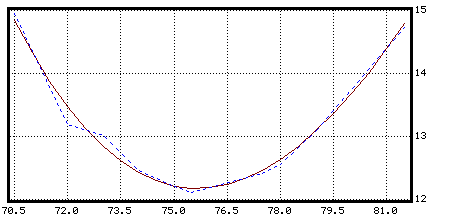
MAY Volatility Skew
Last Trading Date: May 7, 2004

Strike v. Volatility
www.pmpublishing.com

JUN - AD Previous (MAY) - Top
SETTLE (CLOSE) FAIR VALUE TICKS OVER FAIR IMPLIED VOLATILITY IMPLIED DELTA VEGA GAMMA THETA C/R
STRIKE Call Put Call Put Call Put Call Put Call Put (ticks) (ticks) (ticks)
68.0
69.0
70.0
71.0
72.0
72.5
73.0
74.0
74.5
75.0
75.5
76.0*
76.5
77.0
77.5
78.0
78.5
79.0
79.5
80.0
80.5
81.0
81.5
82.0
82.5
83.0
85.0
---
707
613
519
429
---
345
268
235
203
174
148
126
107
89
74
61
51
42
34
28
23
19
16
13
11
2
6
9
14
20
30
37
46
69
85
103
124
148
176
207
239
273
---
350
---
---
---
---
---
615
---
---
---
800
701
604
511
422
380
340
267
233
202
174
148
125
105
87
72
58
47
37
30
23
18
14
10
8
6
2
1
3
7
14
25
33
43
68
84
103
125
148
175
204
236
270
306
345
385
427
470
514
560
607
654
702
900
---
+6
+9
+8
+7
---
+5
+1
+2
+1
0
0
+1
+2
+2
+2
+3
+4
+5
+4
+5
+5
+5
+6
+5
+5
0
+5
+6
+7
+6
+5
+4
+3
+1
+1
0
-1
0
+1
+3
+3
+3
---
+5
---
---
---
---
---
+8
---
---
---
----
15.18
14.77
13.85
13.17
----
12.71
12.30
12.33
12.22
12.16
12.13
12.21
12.33
12.33
12.39
12.44
12.61
12.71
12.76
12.91
13.05
13.22
13.46
13.58
13.82
12.54
15.09
14.53
14.10
13.40
12.89
12.69
12.55
12.25
12.22
12.15
12.13
12.13
12.25
12.40
12.44
12.45
----
12.75
----
----
----
----
----
14.05
----
----
----
*.97
.95
.92
.89
.85
*.82
.79
.71
.66
.61
.56
.51
.45
.40
.35
.31
.27
.23
.20
.17
.14
.12
.10
.09
.07
.06
.01
-.03
-.05
-.07
-.10
-.14
-.17
-.21
-.28
-.33
-.38
-.43
-.49
-.54
-.59
-.64
-.68
*-.73
-.76
*-.80
*-.83
*-.85
*-.88
*-.90
-.90
*-.93
*-.94
*-1.00
.02
.03
.04
.06
.07
.08
.09
.10
.11
.12
.12
.12
.12
.12
.11
.11
.10
.09
.09
.08
.07
.06
.05
.05
.04
.04
.01
2
2
3
4
6
6
7
9
10
10
10
11
10
10
10
9
9
8
7
6
6
5
4
4
3
3
1.0
0.4
0.5
0.7
0.8
1.0
1.2
1.3
1.5
1.6
1.6
1.7
1.7
1.7
1.7
1.6
1.6
1.5
1.4
1.3
1.1
1.0
0.9
0.8
0.8
0.7
0.6
0.2
---
2
1
1
1
---
1
1
0
0
0
0
0
0
0
1
---
1
---
---
---
---
---
1
---
---
---
JUN Fut=76.00 Days=43 atmVol=12.17% IntRate = 6.50%
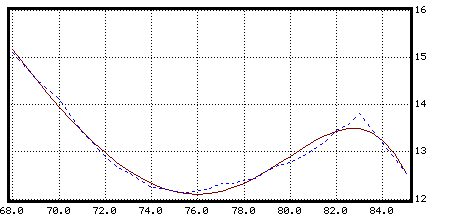
JUN Volatility Skew
Last Trading Date: June 4, 2004

Strike v. Volatility
www.pmpublishing.com

We are currently in the process of adding features to the site. Please do not hesitate to let us know what trading tools you would like to have. You can submit your email address if you want a reply or if you want to be informed of future updates.
Suggestions:
E-mail:

PMpublishing's Daily Options Summary Home Page

Click Here for FREE Options Summaries Emailed Directly to you

E-mail: info@pmpublishing.com

Copyright © 1995-2001, PMpublishing
Disclaimer