| Sponsored by PMpublishing | |
 | |
Daily Sugar Option Analysis -
Tue, July 31, 2001
Hit reload on your browser if the date is incorrect.
Help
FREE Email Summaries
|
Month SEP |
Futures Closing Price 7.93 |
Days Left 11 |
Implied ATM Volatility 270.25% |
Last Trading Date Fri, Aug. 10, 2001 |
|
|
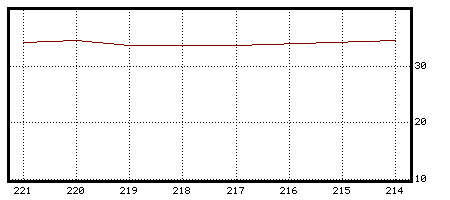
OCT Implied Volatility v. 6-Week Historical Volatility
February 5, 2001 - February 12, 2001

Days to Options Expiration v. Volatility (percent)
Solid line is Implied Volatility
Historical Volatilities for HS
| 1-Week | 2-Week | 1-Month | 6-Week | 2-Month | 3-Month | 4-Month | 6-Month | |
|---|---|---|---|---|---|---|---|---|
|
SEP OCT |
19.06% 19.06% |
n/a n/a |
n/a n/a |
n/a n/a |
n/a n/a |
n/a n/a |
n/a n/a |
n/a n/a |
Implied Standard Deviations for HS
| 1-Day | 3-Day | 1-Week | 2-Week | 1-Month | 2-Month | 3-Month | ATM Vol. | |
|---|---|---|---|---|---|---|---|---|
|
SEP |
1.12 |
1.94 |
2.97 |
4.20 |
6.14 |
8.76 |
10.70 |
270.25% |