CME
SP ES NK ND ED EY
JY BP AD CD MP SF
LC FC LH LB
CBOT
DJ US TY WT
SB BO SM C
CBOE
SX OX
CSCE
CA CF HS
NYCE
OJ CT
NYMEX
HO CL NG HU
COMEX
GC SI HG
DAILY SUMMARY
Main Page
Opt Calc
NEW - Web POP
Bookstore
Sponsored by PMpublishing
NEW FEATURE - Web POP, interactive, online options risk management. Click Here for more information.

Daily Copper Option Analysis - Mon, June 9, 2003
Hit reload on your browser if the date is incorrect.
Help
FREE Email Summaries
Month
JUL
AUG
SEP
OCT
NOV
FEB
MAR
APR
MAY
JUN
Futures
Closing Price

77.00
77.20
77.35
77.50
77.65
78.10
78.25
78.40
78.50
78.55
Days Left
13
36
57
79
102
167
187
209
232
252
Implied ATM
Volatility

24.77%
21.29%
19.50%
24.71%
24.79%
18.24%
18.69%
19.17%
19.36%
19.49%
Last Trading Date
Wed, Jun. 25, 2003
Mon, Jul. 28, 2003
Tue, Aug. 26, 2003
Thu, Sep. 25, 2003
Tue, Oct. 28, 2003
Tue, Jan. 27, 2004
Tue, Feb. 24, 2004
Thu, Mar. 25, 2004
Tue, Apr. 27, 2004
Tue, May 25, 2004
ArrowHistorical v. Implied Volatility Graphs
ArrowHistorical Volatility Tables
ArrowImplied Standard Deviations


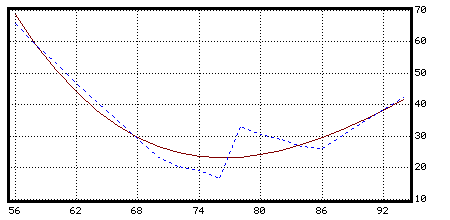
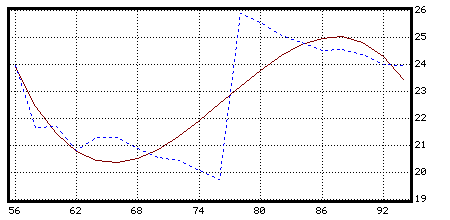
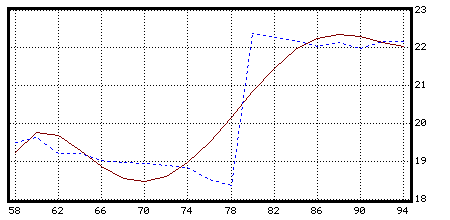
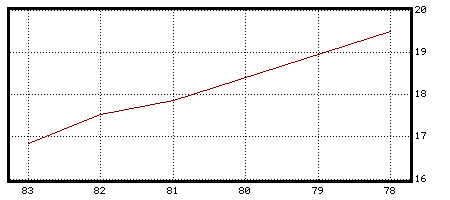
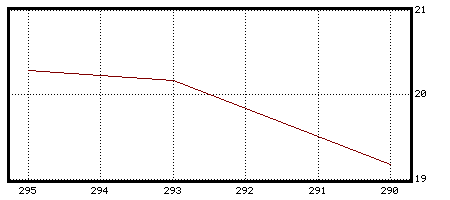
JUL Implied Volatility v. 1-Week Historical Volatility
June 4, 2010 - June 9, 2010

Days to Options Expiration v. Volatility (percent)
Solid line is Implied Volatility


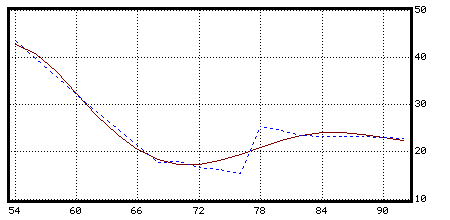
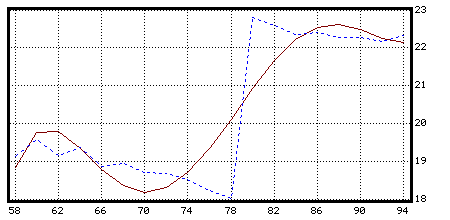
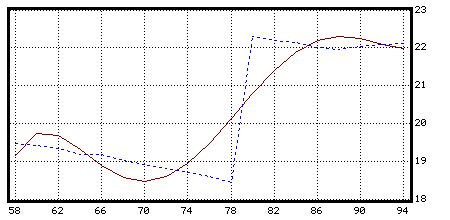
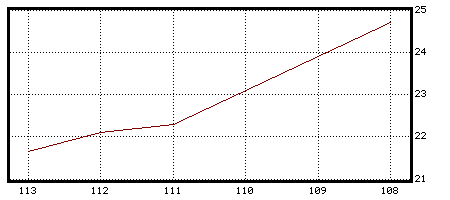
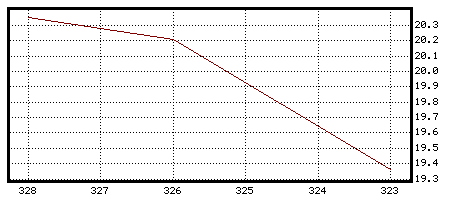
AUG Implied Volatility v. 1-Week Historical Volatility
June 4, 2010 - June 9, 2010

Days to Options Expiration v. Volatility (percent)
Solid line is Implied Volatility


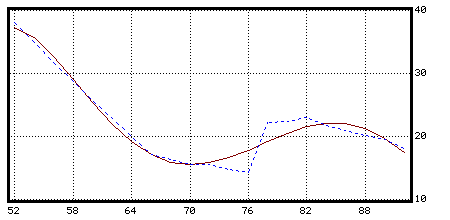
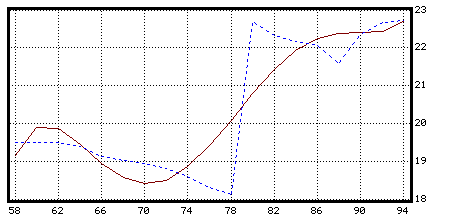
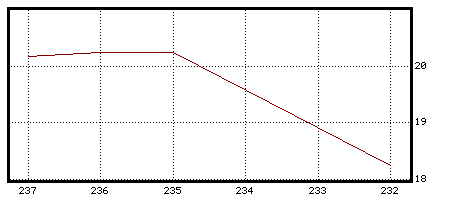
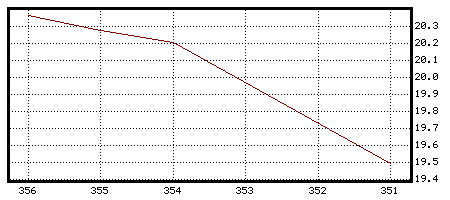
SEP Implied Volatility v. 1-Week Historical Volatility
June 4, 2010 - June 9, 2010

Days to Options Expiration v. Volatility (percent)
Solid line is Implied Volatility


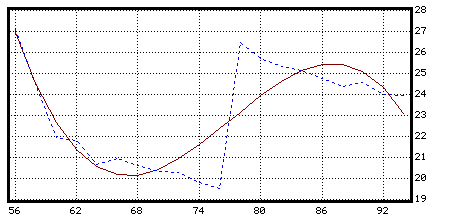
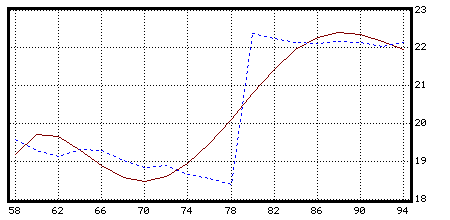
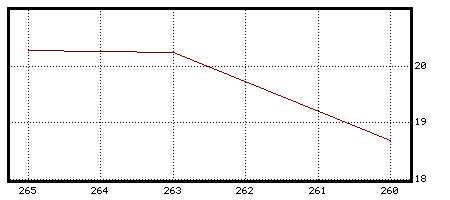
OCT Implied Volatility v. 1-Week Historical Volatility
June 4, 2010 - June 9, 2010

Days to Options Expiration v. Volatility (percent)
Solid line is Implied Volatility


NOV Implied Volatility v. 1-Week Historical Volatility
June 4, 2010 - June 9, 2010

Days to Options Expiration v. Volatility (percent)
Solid line is Implied Volatility


FEB Implied Volatility v. 1-Week Historical Volatility
June 4, 2010 - June 9, 2010

Days to Options Expiration v. Volatility (percent)
Solid line is Implied Volatility


MAR Implied Volatility v. 1-Week Historical Volatility
June 4, 2010 - June 9, 2010

Days to Options Expiration v. Volatility (percent)
Solid line is Implied Volatility


APR Implied Volatility v. 1-Week Historical Volatility
June 4, 2010 - June 9, 2010

Days to Options Expiration v. Volatility (percent)
Solid line is Implied Volatility


MAY Implied Volatility v. 1-Week Historical Volatility
June 4, 2010 - June 9, 2010

Days to Options Expiration v. Volatility (percent)
Solid line is Implied Volatility


JUN Implied Volatility v. 1-Week Historical Volatility
June 4, 2010 - June 9, 2010

Days to Options Expiration v. Volatility (percent)
Solid line is Implied Volatility


Historical Volatilities for HG
1-Week 2-Week 1-Month 6-Week 2-Month 3-Month 4-Month 6-Month


Implied Standard Deviations for HG
1-Day 3-Day 1-Week 2-Week 1-Month 2-Month 3-Month ATM Vol.
JUL
AUG
SEP
OCT
NOV
FEB
MAR
APR
MAY
JUN
1.18
1.02
.93
1.19
1.19
.88
.91
.93
.94
.95
2.04
1.76
1.62
2.05
2.06
1.53
1.57
1.61
1.63
1.64
3.12
2.69
2.47
3.14
3.15
2.33
2.39
2.46
2.49
2.51
4.42
3.81
3.49
4.44
4.46
3.30
3.39
3.48
3.52
3.55
6.47
5.57
5.11
6.49
6.53
4.83
4.96
5.10
5.15
5.19
9.22
7.95
7.29
9.26
9.31
6.89
7.07
7.27
7.35
7.40
11.26
9.70
8.91
11.31
11.37
8.41
8.63
8.88
8.98
9.04
24.77%
21.29%
19.50%
24.71%
24.79%
18.24%
18.69%
19.17%
19.36%
19.49%


JUL - HG Next (AUG) - Top
SETTLE (CLOSE) FAIR VALUE TICKS OVER FAIR IMPLIED VOLATILITY IMPLIED DELTA VEGA GAMMA THETA C/R
STRIKE Call Put Call Put Call Put Call Put Call Put (ticks) (ticks) (ticks)
56
58
60
62
64
66
68
70
72
74
76*
78
80
82
84
86
88
90
92
94
2240
2040
1840
1640
1440
1240
1040
845
650
470
310
180
95
45
15
5
5
5
5
5
5
5
5
5
5
5
5
5
10
30
70
140
255
400
575
765
960
1160
1360
1560
2100
1900
1700
1500
1300
1100
900
706
521
357
223
125
63
28
11
4
1
---
---
---
---
---
---
---
---
---
2
7
22
58
123
225
362
527
709
902
1100
1300
1500
1700
+140
+140
+140
+140
+140
+140
+140
+139
+129
+113
+87
+55
+32
+17
+4
+1
+4
+5
+5
+5
+5
+5
+5
+5
+5
+5
+3
-2
-12
-28
-53
-85
-107
-127
-134
-137
-140
-140
-140
-140
----
----
112.91
102.33
91.91
81.58
71.29
61.91
52.18
44.29
37.86
32.91
30.40
28.99
26.57
25.88
30.26
34.44
38.45
42.30
65.56
59.16
52.91
46.81
40.82
34.93
29.10
23.30
20.18
19.02
16.63
11.70
----
----
----
----
----
----
----
----
*.99
*.99
.87
.85
.84
.82
.80
.77
.74
.67
.58
.44
.30
.17
.08
.03
.03
.02
.02
.02
-.01
-.01
-.01
-.02
-.02
-.02
-.03
-.03
-.06
-.17
-.35
-.68
*-.70
*-.82
*-.92
*-.97
*-.98
*-.98
*-.98
*-.98
.01
.01
.04
.04
.04
.04
.05
.05
.06
.06
.07
.07
.06
.04
.02
.01
.01
.01
.01
.01
0.3
0.3
0.4
0.5
0.7
0.9
1
2
4
8
13
18
7
5
3
2
1
0.9
0.8
0.6
1.3
1.3
1.2
1.2
1.2
1.1
1.1
1.0
1.6
3.2
4.1
2.8
7.0
4.9
2.4
1.1
1.1
1.2
1.2
1.2
135
135
135
135
135
135
135
140
140
140
140
60
140
145
140
140
145
145
145
145
JUL Fut=77.00 Days=13 atmVol=24.77% IntRate = 6.50%
JUL Volatility Skew
Last Trading Date: June 25, 2003

Strike v. Volatility
www.pmpublishing.com

AUG - HG Next (SEP) - Previous (JUL) - Top
SETTLE (CLOSE) FAIR VALUE TICKS OVER FAIR IMPLIED VOLATILITY IMPLIED DELTA VEGA GAMMA THETA C/R
STRIKE Call Put Call Put Call Put Call Put Call Put (ticks) (ticks) (ticks)
54
56
58
60
62
64
66
68
70
72
74
76
78*
80
82
84
86
88
90
92
2450
2250
2050
1850
1650
1450
1250
1050
860
675
510
365
250
165
100
60
35
20
10
5
5
5
5
5
5
5
5
5
15
30
65
120
200
310
450
605
780
965
1155
1350
2320
2120
1920
1720
1520
1320
1121
928
746
577
429
304
205
132
80
46
25
13
7
3
---
---
---
---
---
2
5
13
30
61
111
185
285
410
557
722
900
1088
1282
1480
+130
+130
+130
+130
+130
+130
+129
+122
+114
+98
+81
+61
+45
+33
+20
+14
+10
+7
+3
+2
+5
+5
+5
+5
+5
+3
0
-8
-15
-31
-46
-65
-85
-100
-107
-117
-120
-123
-127
-130
88.00
81.10
74.38
67.82
61.39
55.07
48.82
42.60
37.57
32.77
29.41
26.79
25.24
24.45
23.51
23.25
23.19
23.26
22.92
22.82
43.63
39.67
35.83
32.08
28.42
24.83
21.29
17.80
17.86
16.70
16.30
15.36
13.77
10.76
----
----
----
----
----
----
.89
.88
.88
.87
.85
.84
.83
.81
.78
.73
.67
.58
.47
.36
.26
.17
.11
.07
.04
.02
-.01
-.01
-.01
-.01
-.02
-.02
-.02
-.03
-.07
-.12
-.23
-.38
-.57
-.80
*-.74
*-.82
*-.88
*-.93
*-.96
*-.99
.05
.05
.06
.06
.06
.07
.07
.08
.08
.09
.10
.11
.11
.11
.09
.07
.05
.04
.02
.01
0.2
0.3
0.3
0.4
0.5
0.6
0.8
1
2
4
6
9
10
9
5
4
3
2
1
0.8
0.5
0.5
0.5
0.5
0.5
0.4
0.4
0.4
0.9
1.3
2.0
2.3
2.1
1.2
3.0
2.4
1.7
1.2
0.8
0.5
125
125
125
125
125
125
125
125
125
125
125
125
30
135
130
135
135
135
135
135
AUG Fut=77.20 Days=36 atmVol=21.29% IntRate = 6.50%
AUG Volatility Skew
Last Trading Date: July 28, 2003

Strike v. Volatility
www.pmpublishing.com

SEP - HG Next (OCT) - Previous (AUG) - Top
SETTLE (CLOSE) FAIR VALUE TICKS OVER FAIR IMPLIED VOLATILITY IMPLIED DELTA VEGA GAMMA THETA C/R
STRIKE Call Put Call Put Call Put Call Put Call Put (ticks) (ticks) (ticks)
52
54
56
58
60
62
64
66
68
70
72
74
76
78*
80
82
84
86
88
90
92
2665
2465
2265
2065
1865
1665
1465
1265
1070
880
705
545
405
285
210
155
95
55
30
15
5
5
5
5
5
5
5
5
5
10
20
45
80
140
225
345
485
625
785
955
1140
1335
2535
2335
2135
1935
1735
1535
1335
1139
951
774
612
469
347
248
171
113
72
44
26
15
8
---
---
---
---
---
2
4
11
23
46
83
138
214
312
433
573
731
902
1083
1272
1466
+130
+130
+130
+130
+130
+130
+130
+126
+119
+106
+93
+76
+58
+37
+39
+42
+23
+11
+4
0
-3
+5
+5
+5
+5
+5
+3
+1
-6
-13
-26
-38
-58
-74
-87
-88
-88
-106
-117
-128
-132
-131
77.14
71.35
65.74
60.28
54.95
49.74
44.62
39.56
35.05
30.93
27.88
25.45
23.64
22.08
22.37
22.90
21.71
20.82
20.13
19.47
17.96
38.07
34.83
31.69
28.64
25.66
22.76
19.90
17.10
16.23
15.45
15.45
14.65
14.13
13.35
12.76
10.78
----
----
----
----
----
.89
.89
.88
.87
.86
.85
.84
.82
.80
.77
.72
.66
.58
.48
.39
.31
.22
.15
.09
.05
.02
-.01
-.01
-.01
-.01
-.01
-.02
-.02
-.02
-.04
-.08
-.15
-.25
-.38
-.54
-.70
-.87
*-.77
*-.85
*-.91
*-.95
*-1.00
.06
.06
.07
.07
.08
.08
.08
.09
.10
.11
.12
.13
.14
.14
.14
.13
.11
.08
.06
.04
.02
0.2
0.2
0.3
0.3
0.4
0.5
0.6
0.8
1
3
4
6
7
8
7
5
4
3
2
2
0.8
0.3
0.3
0.3
0.3
0.3
0.3
0.3
0.3
0.4
0.7
1.1
1.4
1.7
1.6
1.4
0.7
2.0
1.5
1.0
0.7
0.3
125
125
125
125
125
125
125
125
125
125
125
130
130
5
130
135
135
135
140
140
135
SEP Fut=77.35 Days=57 atmVol=19.50% IntRate = 6.50%
SEP Volatility Skew
Last Trading Date: August 26, 2003

Strike v. Volatility
www.pmpublishing.com

OCT - HG Next (NOV) - Previous (SEP) - Top
SETTLE (CLOSE) FAIR VALUE TICKS OVER FAIR IMPLIED VOLATILITY IMPLIED DELTA VEGA GAMMA THETA C/R
STRIKE Call Put Call Put Call Put Call Put Call Put (ticks) (ticks) (ticks)
56
58
60
62
64
66
68
70
72
74
76
78*
80
82
84
86
88
90
92
94
2275
2075
1875
1675
1480
1295
1115
945
790
650
525
420
325
250
190
140
100
75
50
35
5
5
5
10
15
30
50
80
125
180
255
345
450
570
705
855
1015
1185
1360
1545
2150
1950
1751
1557
1370
1192
1025
870
728
600
488
391
309
240
184
139
104
77
56
40
3
5
11
20
34
56
87
130
185
255
340
440
555
684
825
978
1141
1312
1490
1673
+125
+125
+124
+118
+110
+103
+90
+75
+62
+50
+37
+29
+16
+10
+6
+1
-4
-2
-6
-5
+2
0
-6
-10
-19
-26
-37
-50
-60
-75
-85
-95
-105
-114
-120
-123
-126
-127
-130
-128
56.29
51.59
47.00
42.52
38.62
35.64
32.91
30.69
29.11
27.93
26.98
26.45
25.70
25.33
25.10
24.75
24.35
24.54
23.98
23.92
27.06
24.46
21.94
21.77
20.65
20.91
20.61
20.33
20.25
19.77
19.51
19.03
18.30
17.21
15.55
11.88
----
----
----
----
.88
.87
.86
.85
.84
.81
.78
.75
.70
.64
.57
.50
.43
.36
.30
.24
.19
.15
.11
.08
-.01
-.01
-.01
-.03
-.04
-.07
-.11
-.16
-.23
-.31
-.40
-.50
-.60
-.70
-.81
-.95
*-.81
*-.85
*-.89
*-.92
.08
.08
.09
.09
.10
.11
.12
.13
.14
.16
.16
.17
.17
.16
.15
.13
.11
.10
.08
.06
0.3
0.3
0.4
0.7
1.0
2
2
3
4
4
5
5
5
5
4
2
3
2
2
1
0.2
0.2
0.2
0.4
0.5
0.8
1.0
1.3
1.6
1.8
2.0
2.0
1.8
1.6
1.1
0.4
1.7
1.5
1.2
0.9
120
120
120
115
115
115
115
115
115
120
120
25
125
130
135
135
135
140
140
140
OCT Fut=77.50 Days=79 atmVol=24.71% IntRate = 6.50%
OCT Volatility Skew
Last Trading Date: September 25, 2003

Strike v. Volatility
www.pmpublishing.com

NOV - HG Next (FEB) - Previous (OCT) - Top
SETTLE (CLOSE) FAIR VALUE TICKS OVER FAIR IMPLIED VOLATILITY IMPLIED DELTA VEGA GAMMA THETA C/R
STRIKE Call Put Call Put Call Put Call Put Call Put (ticks) (ticks) (ticks)
56
58
60
62
64
66
68
70
72
74
76
78*
80
82
84
86
88
90
92
94
2290
2090
1890
1695
1505
1320
1150
990
840
705
580
475
385
305
240
185
145
110
80
60
5
5
10
15
30
50
75
110
160
220
295
385
490
610
740
885
1040
1200
1370
1550
2165
1965
1769
1581
1401
1230
1069
920
784
661
551
455
371
300
240
190
149
116
89
68
6
12
21
34
54
82
120
168
229
302
389
489
602
727
864
1011
1167
1331
1503
1680
+125
+125
+121
+114
+104
+90
+81
+70
+56
+44
+29
+20
+14
+5
0
-5
-4
-6
-9
-8
-1
-7
-11
-19
-24
-32
-45
-58
-69
-82
-94
-104
-112
-117
-124
-126
-127
-131
-133
-130
50.48
46.26
42.14
38.59
35.50
32.74
30.94
29.48
28.20
27.29
26.35
25.86
25.53
25.07
24.80
24.49
24.52
24.34
23.97
23.94
23.93
21.65
21.67
20.78
21.28
21.26
20.87
20.54
20.43
20.07
19.72
19.31
18.83
18.24
17.21
15.88
12.69
----
----
----
.88
.87
.86
.85
.83
.81
.77
.73
.69
.63
.57
.51
.45
.39
.33
.27
.23
.18
.14
.11
-.01
-.01
-.02
-.04
-.06
-.10
-.14
-.19
-.25
-.32
-.40
-.48
-.57
-.65
-.74
-.83
-.95
*-.81
*-.85
*-.89
.09
.10
.10
.11
.12
.13
.14
.15
.17
.18
.19
.19
.19
.18
.17
.16
.14
.13
.11
.09
0.3
0.3
0.5
0.8
1
2
2
3
3
4
4
4
4
4
4
3
2
2
2
2
0.2
0.2
0.3
0.4
0.6
0.9
1.1
1.3
1.5
1.7
1.7
1.7
1.7
1.5
1.3
0.9
0.4
1.5
1.3
1.1
120
120
115
115
110
105
110
115
115
120
120
55
130
130
135
135
140
145
145
145
NOV Fut=77.65 Days=102 atmVol=24.79% IntRate = 6.50%
NOV Volatility Skew
Last Trading Date: October 28, 2003

Strike v. Volatility
www.pmpublishing.com

FEB - HG Next (MAR) - Previous (NOV) - Top
SETTLE (CLOSE) FAIR VALUE TICKS OVER FAIR IMPLIED VOLATILITY IMPLIED DELTA VEGA GAMMA THETA C/R
STRIKE Call Put Call Put Call Put Call Put Call Put (ticks) (ticks) (ticks)
58
60
62
64
66
68
70
72
74
76
78*
80
82
84
86
88
90
92
94
2135
1935
1740
1555
1380
1215
1060
915
785
670
560
470
390
320
265
215
175
140
115
10
20
30
50
70
105
145
200
265
340
430
530
650
775
915
1060
1215
1380
1550
2010
1810
1613
1425
1248
1081
927
786
658
545
446
360
287
227
177
137
104
79
59
7
14
24
40
63
95
137
192
259
341
436
545
667
801
947
1102
1267
1439
1619
+125
+125
+127
+130
+132
+134
+133
+129
+127
+125
+114
+110
+103
+93
+88
+78
+71
+61
+56
+3
+6
+6
+10
+7
+10
+8
+8
+6
-1
-6
-15
-17
-26
-32
-42
-52
-59
-69
37.97
34.60
31.68
29.47
27.79
26.49
25.44
24.54
23.94
23.58
22.99
22.80
22.58
22.36
22.39
22.27
22.26
22.16
22.32
19.13
19.58
19.15
19.36
18.86
18.95
18.70
18.66
18.50
18.22
18.00
17.63
17.52
17.04
16.63
15.73
14.31
----
----
.86
.85
.84
.82
.79
.76
.72
.68
.63
.58
.52
.47
.42
.36
.32
.27
.23
.20
.17
-.02
-.04
-.05
-.08
-.11
-.16
-.20
-.26
-.32
-.39
-.45
-.53
-.60
-.67
-.73
-.80
-.89
*-.79
*-.82
.12
.13
.14
.15
.16
.18
.20
.21
.23
.24
.24
.24
.24
.23
.22
.20
.19
.17
.15
0.4
0.7
0.9
1
2
2
2
3
3
3
3
4
3
3
3
3
2
2
2
0.2
0.3
0.4
0.5
0.7
0.8
1.0
1.1
1.2
1.2
1.2
1.2
1.2
1.1
0.9
0.8
0.5
1.1
1.0
115
105
100
95
100
100
105
105
110
120
120
130
130
135
140
145
150
150
155
FEB Fut=78.10 Days=167 atmVol=18.24% IntRate = 6.50%
FEB Volatility Skew
Last Trading Date: January 27, 2004

Strike v. Volatility
www.pmpublishing.com

MAR - HG Next (APR) - Previous (FEB) - Top
SETTLE (CLOSE) FAIR VALUE TICKS OVER FAIR IMPLIED VOLATILITY IMPLIED DELTA VEGA GAMMA THETA C/R
STRIKE Call Put Call Put Call Put Call Put Call Put (ticks) (ticks) (ticks)
58
60
62
64
66
68
70
72
74
76
78*
80
82
84
86
88
90
92
94
2150
1950
1760
1575
1405
1240
1090
950
820
700
595
505
420
350
290
230
205
175
145
15
25
40
60
85
120
165
220
285
360
450
550
665
785
920
1055
1225
1390
1560
2025
1825
1632
1448
1275
1113
963
825
700
588
489
403
328
265
212
169
133
103
80
12
20
34
53
79
115
160
218
287
369
465
572
692
824
965
1117
1277
1445
1620
+125
+125
+128
+127
+130
+127
+127
+125
+120
+112
+106
+102
+92
+85
+78
+61
+72
+72
+65
+3
+5
+6
+7
+6
+5
+5
+2
-2
-9
-15
-22
-27
-39
-45
-62
-52
-55
-60
36.40
33.18
30.73
28.58
27.22
25.92
25.10
24.41
23.80
23.23
22.86
22.70
22.33
22.18
22.07
21.57
22.36
22.67
22.72
19.50
19.48
19.49
19.39
19.13
19.02
18.93
18.80
18.59
18.30
18.11
17.81
17.59
17.05
16.59
15.42
15.49
14.27
----
.86
.85
.84
.82
.79
.76
.72
.68
.63
.58
.53
.48
.42
.38
.33
.28
.25
.22
.19
-.03
-.04
-.07
-.09
-.12
-.16
-.21
-.26
-.32
-.38
-.45
-.51
-.58
-.65
-.71
-.79
-.84
-.91
*-.80
.13
.14
.15
.16
.17
.19
.21
.22
.24
.25
.25
.26
.25
.25
.23
.22
.21
.19
.18
0.5
0.7
1.0
1
2
2
2
3
3
3
3
3
3
3
3
3
2
2
2
0.2
0.3
0.4
0.6
0.7
0.8
0.9
1.0
1.1
1.2
1.2
1.2
1.1
1.0
0.9
0.7
0.6
0.4
1.1
110
100
95
90
95
95
100
105
110
115
120
130
130
140
145
150
155
160
160
MAR Fut=78.25 Days=187 atmVol=18.69% IntRate = 6.50%
MAR Volatility Skew
Last Trading Date: February 24, 2004

Strike v. Volatility
www.pmpublishing.com

APR - HG Next (MAY) - Previous (MAR) - Top
SETTLE (CLOSE) FAIR VALUE TICKS OVER FAIR IMPLIED VOLATILITY IMPLIED DELTA VEGA GAMMA THETA C/R
STRIKE Call Put Call Put Call Put Call Put Call Put (ticks) (ticks) (ticks)
58
60
62
64
66
68
70
72
74
76
78*
80
82
84
86
88
90
92
94
2160
1960
1775
1595
1425
1265
1115
975
850
735
630
535
455
385
325
275
230
190
160
20
30
45
70
100
135
180
240
305
385
475
575
690
810
945
1090
1240
1395
1560
2040
1842
1653
1474
1305
1148
1001
866
744
633
535
449
373
308
252
205
166
133
106
18
29
46
68
99
138
187
247
318
401
496
603
721
850
988
1136
1292
1455
1625
+120
+118
+122
+121
+120
+117
+114
+109
+106
+102
+95
+86
+82
+77
+73
+70
+64
+57
+54
+2
+1
-1
+2
+1
-3
-7
-7
-13
-16
-21
-28
-31
-40
-43
-46
-52
-60
-65
34.58
31.51
29.51
27.74
26.40
25.37
24.54
23.85
23.44
23.06
22.71
22.38
22.25
22.15
22.11
22.16
22.13
22.04
22.15
19.57
19.28
19.11
19.32
19.27
19.02
18.84
18.87
18.64
18.54
18.37
18.13
18.00
17.61
17.36
17.07
16.47
15.34
12.15
.86
.85
.83
.81
.79
.75
.72
.67
.63
.58
.53
.48
.43
.39
.34
.30
.26
.23
.20
-.03
-.05
-.07
-.10
-.13
-.17
-.22
-.27
-.32
-.38
-.44
-.50
-.56
-.62
-.68
-.74
-.80
-.87
-1.00
.13
.14
.15
.17
.19
.20
.22
.24
.25
.26
.27
.27
.27
.26
.25
.24
.23
.21
.19
0.5
0.7
1.0
1
2
2
2
2
3
3
3
3
3
3
3
3
2
2
1
0.2
0.3
0.4
0.6
0.7
0.8
0.9
1.0
1.1
1.1
1.1
1.1
1.1
1.0
0.9
0.9
0.7
0.5
0.2
100
90
90
85
85
90
95
95
105
110
115
120
125
135
140
145
150
155
160
APR Fut=78.40 Days=209 atmVol=19.17% IntRate = 6.50%
APR Volatility Skew
Last Trading Date: March 25, 2004

Strike v. Volatility
www.pmpublishing.com

MAY - HG Next (JUN) - Previous (APR) - Top
SETTLE (CLOSE) FAIR VALUE TICKS OVER FAIR IMPLIED VOLATILITY IMPLIED DELTA VEGA GAMMA THETA C/R
STRIKE Call Put Call Put Call Put Call Put Call Put (ticks) (ticks) (ticks)
58
60
62
64
66
68
70
72
74
76
78*
80
82
84
86
88
90
92
94
2170
1975
1790
1610
1445
1285
1140
1005
880
765
660
570
490
420
355
305
255
220
185
25
40
55
80
110
150
200
260
330
405
495
595
710
835
965
1105
1255
1410
1570
2050
1854
1669
1493
1328
1174
1031
899
778
669
571
485
408
342
285
235
193
158
129
24
38
57
82
116
158
209
271
344
428
523
629
746
872
1009
1153
1306
1467
1634
+120
+121
+121
+117
+117
+111
+109
+106
+102
+96
+89
+85
+82
+78
+70
+70
+62
+62
+56
+1
+2
-2
-2
-6
-8
-9
-11
-14
-23
-28
-34
-36
-37
-44
-48
-51
-57
-64
33.27
30.65
28.69
26.95
25.88
24.84
24.21
23.69
23.25
22.86
22.51
22.37
22.26
22.20
22.03
22.13
21.97
22.18
22.16
19.48
19.62
19.20
19.19
19.02
18.97
18.94
18.90
18.82
18.52
18.36
18.16
18.08
17.98
17.66
17.32
16.96
16.30
15.00
.86
.85
.83
.81
.78
.75
.71
.67
.63
.58
.53
.49
.44
.40
.35
.32
.28
.25
.21
-.04
-.06
-.08
-.11
-.14
-.18
-.22
-.27
-.32
-.38
-.43
-.49
-.55
-.61
-.66
-.72
-.77
-.83
-.90
.14
.15
.16
.18
.20
.21
.23
.25
.26
.27
.28
.28
.28
.28
.27
.26
.24
.23
.21
0.6
0.8
1
1
2
2
2
2
3
3
3
3
3
3
3
2
2
2
2
0.3
0.4
0.4
0.5
0.6
0.8
0.9
0.9
1.0
1.0
1.0
1.0
1.0
1.0
0.9
0.8
0.7
0.6
0.4
95
85
85
80
85
85
90
95
100
110
115
125
130
135
140
150
150
160
165
MAY Fut=78.50 Days=232 atmVol=19.36% IntRate = 6.50%
MAY Volatility Skew
Last Trading Date: April 27, 2004

Strike v. Volatility
www.pmpublishing.com

JUN - HG Previous (MAY) - Top
SETTLE (CLOSE) FAIR VALUE TICKS OVER FAIR IMPLIED VOLATILITY IMPLIED DELTA VEGA GAMMA THETA C/R
STRIKE Call Put Call Put Call Put Call Put Call Put (ticks) (ticks) (ticks)
58
60
62
64
66
68
70
72
74
76
78*
80
82
84
86
88
90
92
94
2175
1980
1800
1625
1460
1305
1160
1025
900
790
685
595
515
445
380
325
280
240
205
30
45
65
90
125
165
215
275
345
425
515
615
730
855
985
1125
1270
1425
1585
2055
1862
1680
1507
1345
1193
1052
922
804
696
599
512
436
369
310
259
216
179
148
30
46
67
95
130
175
228
292
366
451
546
652
768
893
1027
1170
1321
1479
1644
+120
+118
+120
+118
+115
+112
+108
+103
+96
+94
+86
+83
+79
+76
+70
+66
+64
+61
+57
0
-1
-2
-5
-5
-10
-13
-17
-21
-26
-31
-37
-38
-38
-42
-45
-51
-54
-59
32.26
29.71
28.09
26.64
25.54
24.70
24.03
23.48
23.02
22.79
22.43
22.29
22.19
22.14
22.00
21.96
22.04
22.08
22.12
19.46
19.41
19.33
19.16
19.18
19.02
18.91
18.82
18.71
18.58
18.43
18.24
18.20
18.15
17.92
17.70
17.27
16.84
16.07
.86
.85
.83
.80
.78
.74
.71
.67
.62
.58
.53
.49
.45
.40
.36
.32
.29
.26
.23
-.04
-.06
-.09
-.11
-.15
-.18
-.23
-.27
-.32
-.38
-.43
-.49
-.54
-.59
-.65
-.70
-.75
-.80
-.86
.15
.16
.17
.19
.21
.23
.24
.26
.27
.29
.29
.30
.29
.29
.28
.27
.26
.24
.23
0.6
0.8
1
1
2
2
2
2
2
3
3
3
3
3
3
2
2
2
2
0.3
0.4
0.5
0.5
0.7
0.7
0.8
0.9
1.0
1.0
1.0
1.0
1.0
1.0
0.9
0.9
0.8
0.7
0.5
90
80
80
80
80
85
90
95
100
110
115
125
130
135
140
145
155
160
165
JUN Fut=78.55 Days=252 atmVol=19.49% IntRate = 6.50%
JUN Volatility Skew
Last Trading Date: May 25, 2004

Strike v. Volatility
www.pmpublishing.com

We are currently in the process of adding features to the site. Please do not hesitate to let us know what trading tools you would like to have. You can submit your email address if you want a reply or if you want to be informed of future updates.
Suggestions:
E-mail:

PMpublishing's Daily Options Summary Home Page

Click Here for FREE Options Summaries Emailed Directly to you

E-mail: info@pmpublishing.com

Copyright © 1995-2001, PMpublishing
Disclaimer