| Sponsored by PMpublishing | |
 | |
Daily Lumber Option Analysis -
Wed, April 7, 2004
Hit reload on your browser if the date is incorrect.
Help
FREE Email Summaries
|
Month MAY JUL |
Futures Closing Price 389.30 374.80 |
Days Left 18 61 |
Implied ATM Volatility 35.02% 30.24% |
Last Trading Date Fri, Apr. 30, 2004 Wed, Jun. 30, 2004 |
|
|
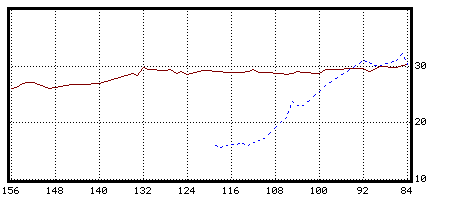
MAY Implied Volatility v. 1-Month Historical Volatility
January 26, 2010 - April 7, 2010
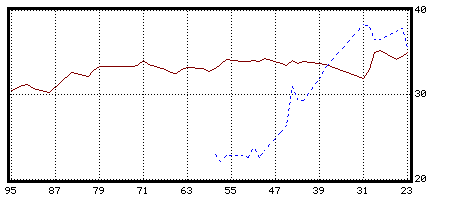
Days to Options Expiration v. Volatility (percent)
Solid line is Implied Volatility
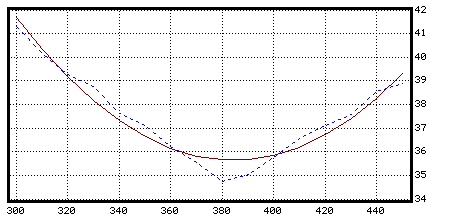
MAY Futures
January 26, 2010 - April 7, 2010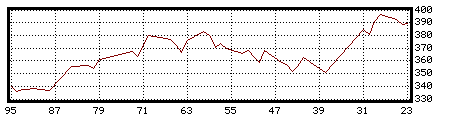
Days to Options Expiration v. Futures Price
JUL Implied Volatility v. 1-Month Historical Volatility
January 26, 2010 - April 7, 2010
Days to Options Expiration v. Volatility (percent)
Solid line is Implied Volatility
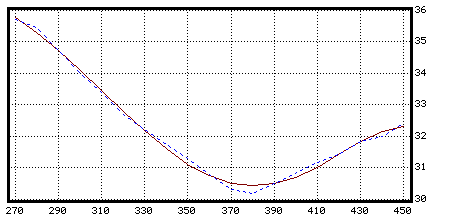
JUL Futures
January 26, 2010 - April 7, 2010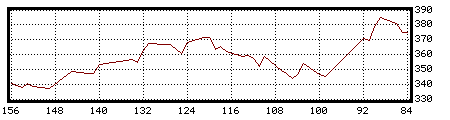
Days to Options Expiration v. Futures Price
Historical Volatilities for LB
| 1-Week | 2-Week | 1-Month | 6-Week | 2-Month | 3-Month | 4-Month | 6-Month | |
|---|---|---|---|---|---|---|---|---|
|
MAY JUL |
20.06% 24.71% |
38.71% 32.30% |
35.52% 30.36% |
32.97% 27.36% |
29.20% 23.56% |
n/a n/a |
n/a n/a |
n/a n/a |
Implied Standard Deviations for LB
| 1-Day | 3-Day | 1-Week | 2-Week | 1-Month | 2-Month | 3-Month | ATM Vol. | |
|---|---|---|---|---|---|---|---|---|
|
MAY JUL |
8.44 7.01 |
14.62 12.15 |
22.33 18.56 |
31.58 26.25 |
46.22 38.42 |
65.91 54.79 |
80.51 66.91 |
35.02% 30.24% |